
Stability of explanations in software-trace classification
A study of trace representations and the signals that may influence classification.
Read the entry ↗
Cybersecurity · Explainable AI · Information Theory · Quantum Computing · Quantitative Finance
My work in cybersecurity and explainable artificial intelligence continues an inquiry into data, models and knowledge that began in computational physics. My interest in classical and quantum information theory accompanies this path alongside quantum computing and quantitative finance, shaping the questions I bring to research and teaching.
University of Milan
Università Cattolica del Sacro Cuore
Choose a course and academic year to reach its entry and the available materials.
OpenFollow the questions running through the studies, comparing methods, findings and references.
OpenTwo galaxies to explore: Quantum Lab and GeoStat Lab, from quantum computing to statistics for Earth sciences.
Explore the mapA study of trace representations and the signals that may influence classification.
Read the entry ↗The relationship between ransomware detection, trace regularity and model interpretability.
Read the entry ↗Cages, ribbons and periodic surfaces: explore atomic bonds and the questions connecting geometry to materials research.
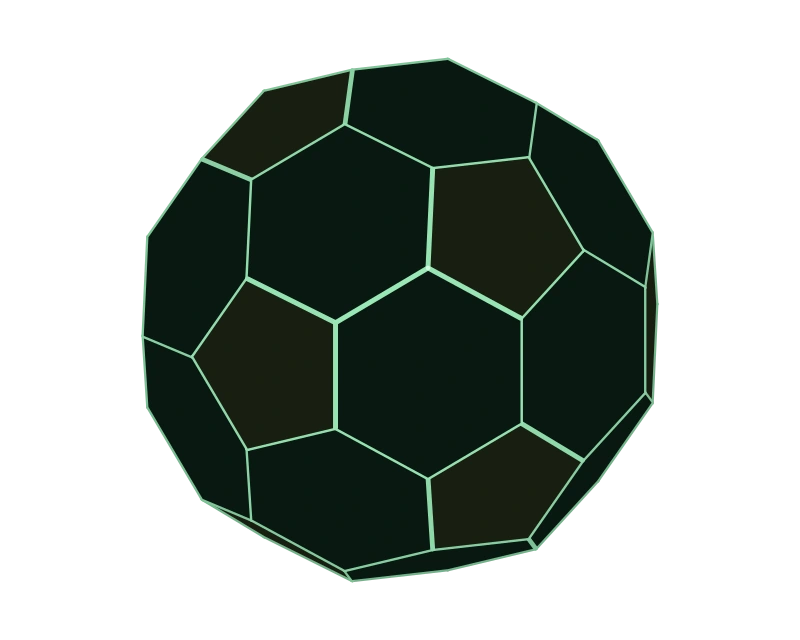
Twelve pentagons allow a hexagonal carbon network to close into a cage, revealing how ring arrangement accompanies the curvature of a closed carbon surface.
Formula and scientific context ↗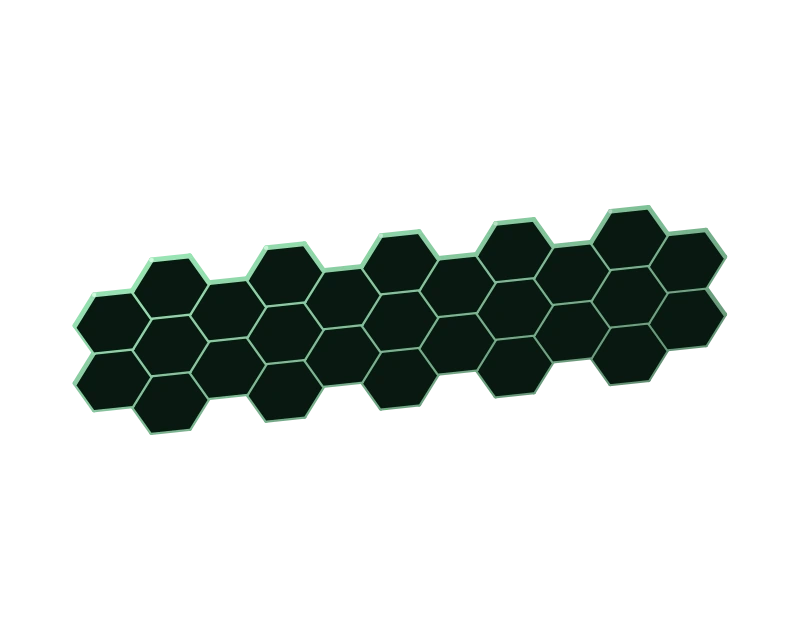
Cutting a graphene sheet leaves an atomic edge whose properties can be investigated through spectroscopy and calculations. The two views make armchair and zigzag terminations recognisable.
Formula and scientific context ↗Alerts in European schools show how an unfounded threat can consume resources, change decisions and prolong its effects. This essay examines that pressure through cognitive overload, orientation and the OODA loop in John Boyd’s thinking.
The profile and the page about the site’s name bring together the personal journey and readings that accompany the scientific work, while the atlas collects figures through which to explore the geometric relationships discussed in the texts.
Carbon cages and positive curvature
Twelve pentagons allow a hexagonal carbon network to close into a cage, revealing how ring arrangement accompanies the curvature of a closed carbon surface.
Follow a pentagon and compare its boundary with neighbouring hexagons. Rotate the cage to trace the continuous network and the three bonds meeting at each atom. Compare this convex cage with the periodic saddle openings of the schwarzite.
V = 60, E = 90, F = 32
12 pentagons + 20 hexagons
V − E + F = 2; three neighbours per vertex.
Sixty vertices and ninety edges enclose thirty-two faces: twelve pentagons and twenty hexagons. Vertices minus edges plus faces equals two.
This is an ideal truncated icosahedron with equal bond lengths; molecular C₆₀ has different bond lengths. Dark faces clarify depth and pentagons have a warmer tint. The cage introduces fullerenes. The linked work on two C₂₈ clathrates concerns distinct crystalline structures, whose reconstruction requires specific coordinates.
Atomic edges and vibrational signatures
Cutting a graphene sheet leaves an atomic edge whose properties can be investigated through spectroscopy and calculations. The two views make armchair and zigzag terminations recognisable.
Observe the atom pairs along the armchair edge, then select the zigzag view to compare its different boundary pattern. Follow the hexagons inward and examine the ends of the finite fragment.
Honeycomb lattice: two atoms per primitive cell.
Nearest neighbours: dᵢⱼ = 1 in model units.
Armchair and zigzag: two orientations of the same lattice.
The planar lattice has two atoms per primitive cell and unit bond lengths in this model. The cut direction determines an armchair or zigzag termination.
The finite fragments contain 80 and 84 carbon atoms respectively. Coordinates describe an ideal planar lattice; hydrogen and other terminating groups are omitted. The fragments have different finite dimensions and illustrate edge patterns. The linked Raman and HREELS papers examine specific structures through measurements and calculations. These figures introduce their geometry; peak assignments and frequencies belong to the papers’ experimental and theoretical results.