Topological ManifoldsMarzio De Corato
06 / Resources

Resources.

This page brings together links to course materials, publications in the institutional repository and my curriculum, keeping the references useful while reading the site close at hand.
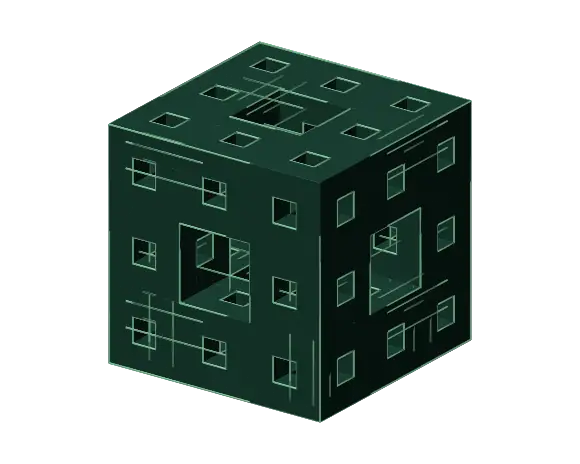
Menger sponge
01 / For study

Course materials

The seven Quantum and Post-Quantum Computing modules contain the course PDFs alongside links to Quantum Lab activities through which you can revisit the topics in simulations.

Go to the seven modules ↗
02 / Further reading

Research repository

The AIR profile at the University of Milan provides publication references, which this site accompanies with introductory entries on the problems and methods addressed.

Open AIR
03 / Profile

CV PDF

The PDF curriculum brings together education, professional experience and academic activities in a document you can consult or retain alongside the profile presented on this site.

Open the CV ↗
04 / Code

GitHub profile

The GitHub profile provides access to public repositories and the code of available projects, together with their descriptions and instructions.

Go to profile

Explore Topological Manifolds

Complete search page ↗

Graph theory and cyber-attacks

Unaffected nodeCompromised node

When devices, services and identities are described through their relationships, system security can be studied as a structural problem in which both a vulnerability and the paths through which it could expose other resources matter.

From connections to attack paths

A graph G = (V, E) consists of vertices V and edges E. In an asset network, vertices may represent devices or services, while edges describe connections, dependencies or trust relationships. An attack graph instead represents conditions, actions or system states, depending on the model, to examine how several steps can combine into a compromise.

G = (V, E)

The analogy with an epidemic helps illustrate how a compromise can spread between nodes, provided that the conditions for each transition are considered. Credentials, permissions, vulnerabilities and configurations determine which paths are feasible; a connection alone describes a possibility of communication.

How this supports defence

Path analysis helps identify the resources reachable from an initial position and the connections that form critical passages. Comparing the graph before and after a change shows how network segmentation, reduced privileges or a vulnerability fix can interrupt particular sequences. A node’s importance depends on its role and context, so its number of connections gives only a partial account of risk.

Reading this figure

Red nodes marked with a cross represent compromised systems in the scenario; green nodes remain unaffected, while pale pulses follow the propagation paths. The map provides a conventional geographical layout for an illustrative network whose links and timing are constructed to clarify the phenomenon. It does not show observed attacks or estimate compromise probabilities.

Explore the model

The model loads when opened.

Drag or use the arrow keys to orient the model; + and − control zoom. Hold Ctrl or ⌘ to zoom with the wheel. Esc closes the dialog.

Topological Manifolds

Interface preferences

Sound remains optional and is controlled by the speaker in the header. Background music has its own player below.

Card entry, clicks and page changes use soft accents; scrolling stays silent.

Original soundtrack · 4:30

Descending Fields

0:00 / 4:30

Music starts when you press Play.

About the composition ↗
Topological Manifolds

Scientific formulas

Relations, assumptions and study references. These are not empirical results from the author’s research.

Research · Teaching · Exploration

Topological
Manifolds

Follow the code, explore the forms. Choose how to enter.

Music and effects have separate volume controls.

topological-manifolds / terminal
Visual transition

Opening the laboratory

Opening the laboratory…

0%

Destination